Scandinavian Marathon Results
Analyze chip timing data. Interpret split metrics. Understand finish categories. Results provide hard data on race performance.
Gross Time vs Net Time
Official results feature two distinct time values. Gross time measures duration from the starting gun to the finish line crossover. Net time measures duration from crossing the start mat to crossing the finish mat. Elite standings utilize gross time. Mass participation standings utilize net time. Net time reflects true pacing effort. Use net time for personal analysis.
Interpreting Split Times
Timing mats record progress at specific intervals. Standard intervals occur at 5k, 10k, Half, 30k, and 40k. Split data reveals pacing strategy. Even pacing maintains consistent kilometers. A positive split denotes a slower second half. A negative split denotes a faster second half. Negative splits indicate optimal energy management. Few mass participants achieve true negative splits.
Categories and Rankings
Overall placement provides limited context. Category placement offers better comparison. Age grading standardizes results. Categories divide by gender and five-year age brackets (e.g., M40-44, W35-39). Filter results by category. Assess performance relative to peers. Standings update dynamically during live timing. Final standings freeze post-race following technical review.
Result Table Structure Example
| Place | Category | Half Split | Net Time | Pacing Note |
|---|---|---|---|---|
| 152 | M30-34 | 01:30:15 | 03:00:10 | Even Split |
| 412 | W25-29 | 01:45:00 | 03:35:45 | Positive Split |
| 889 | M45-49 | 01:55:30 | 03:49:15 | Negative Split |
| 1402 | W40-44 | 02:10:00 | 04:35:12 | Positive Split |
Status Codes: DNF, DNS, DSQ
Result tables list non-finishing codes. DNS means Did Not Start. The runner did not cross the start mat. DNF means Did Not Finish. The runner crossed the start mat but missed the finish. DSQ means Disqualified. The runner violated route regulations or timing rules. Missing intermediate timing mats triggers automated disqualification reviews. Ensure your chip registers at all checkpoints.
Historical Archives
Scandinavian events maintain extensive digital archives. Compare current performance against historical averages. Weather conditions skew yearly averages. A warm year yields slower median times. A cool year yields faster median times. Do not compare times across different events. A flat coastal marathon produces different results than an undulating urban route. Benchmark against the same course.
What to Know
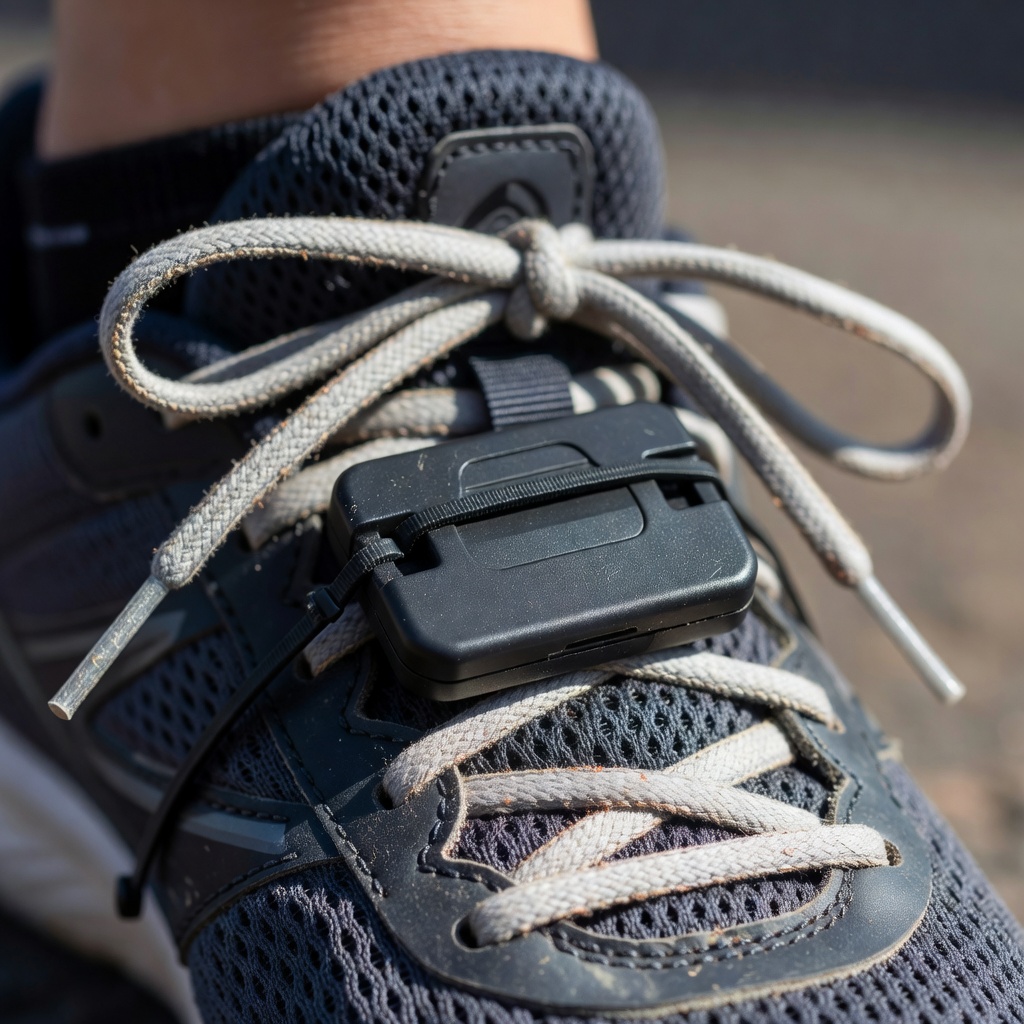
- Always confirm your timing chip is correctly attached to your shoe.
- Live tracking apps experience lag in areas with high cellular density.
- Official certificates usually generate automatically from net time data.
- Fictional data above demonstrates formatting. Do not seek these exact times.